This assignment involves analyzing data from a survey of randomly selected people within Bangkok. The survey responses were simulated. The data is saved in a comma delimited file. You must analyze the data to answer the questions below. There is a dataset for each student. Use the last two digits of your student id# to select the data file. The goal of this assignment as with most assignments is to learn. Although each person has his or her own dataset, you may ask people for help. In addition, you must make graphs using excel, supporting your conclusions. Use an alpha= 0.05 for hypothesis testing. The deliverable is a PowerPoint slide of the graph from Excel with your conclusion for each question and place supporting computer output in the appendix. There are two possible answers for each question to be placed on the page with the Excel graph:
- Yes we feel confident from the sample that …
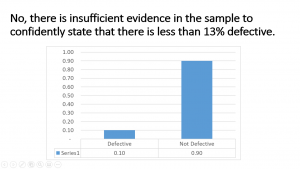
- No, there is insufficient evidence in the sample to confidently state that …
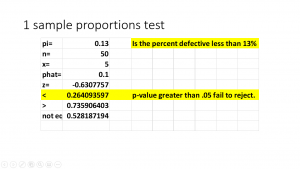
For example, imagine the question:? “Is the percent defective less than 13
Note: In the data file a “1” means the attribute has the property and a “0” represents
the attribute does not have the property. For gender a “1” represents a male. The
material covered in this chapter is not enough to answer all the questions below.
Some questions may require ANOVA and Chi-Squared test, which might not have been covered yet. If not those topics will be covered soon.
1.Less than 70 percent of people in Bangkok have internet.
2.A higher percentage of men have Internet than women.
3.Women use the phone more than men.
4.On average people use the phone more than 390 minutes per month.
5.More than 85 percent of all people are working.
6.A higher percentage of men are working than women.
7.The average usage of the phone of working people is less than that of non-working people.
8.There exists a relationship between the cable company chosen and gender.
9.The average age of people is not the same for each cable company.
10.The average usage of the phone of people with Internet is less than those without Internet.
Below is a link to 30+ data sets you only should work on the dataset that matches your ID last 2 digits.
http://learnviaweb.com/the-survey-datasets/


